Selenoprofiles utilities
Selenoprofiles comes with some utilities for specific use cases. Some require optional dependencies: see the Installation page.
Selenoprofiles was designed for comparative studies across multiples species.
If you search multiple targets (e.g. different species), you may use the same output folder (as long as target and species names are different). As seen above, a subfolder within the output folder is created for each.
Collect results: selenoprofiles join
To collect results from runs on multiple targets, you can use the selenoprofiles join utility. See its usage with:
selenoprofiles join -h
As mentioned, each run of selenoprofiles produces one ali file for each profile with at least one result. The selenoprofiles join utility collects ali files resulting from searching different targets, and outputs a single joined ali file per profile.
Prediction identifiers are augmented in joined ali files to discriminate among targets. They take this form: profile_name.index.label.species_name.target_file_name
Display an overview of results: selenoprofiles drawer
The selenoprofiles drawer utility takes these joined ali files and displays a graphical summary of results.
selenoprofiles drawer -h
Selenoprofiles drawer also takes as input the tree of the species searched in newick format. Therefore, it shows the presence of homologs of the protein families that were searched across the phylogenetic tree of those species.
To obtain (rough) species trees including virtually all known organisms, you may use NCBI taxonomy. This can be done directly at its portal at http://www.ncbi.nlm.nih.gov/Taxonomy/CommonTree/wwwcmt.cgi, or with more automated tools such as https://github.com/didacs/ncbi_taxonomy.
Here is an example of the output of selenoprofiles drawer:
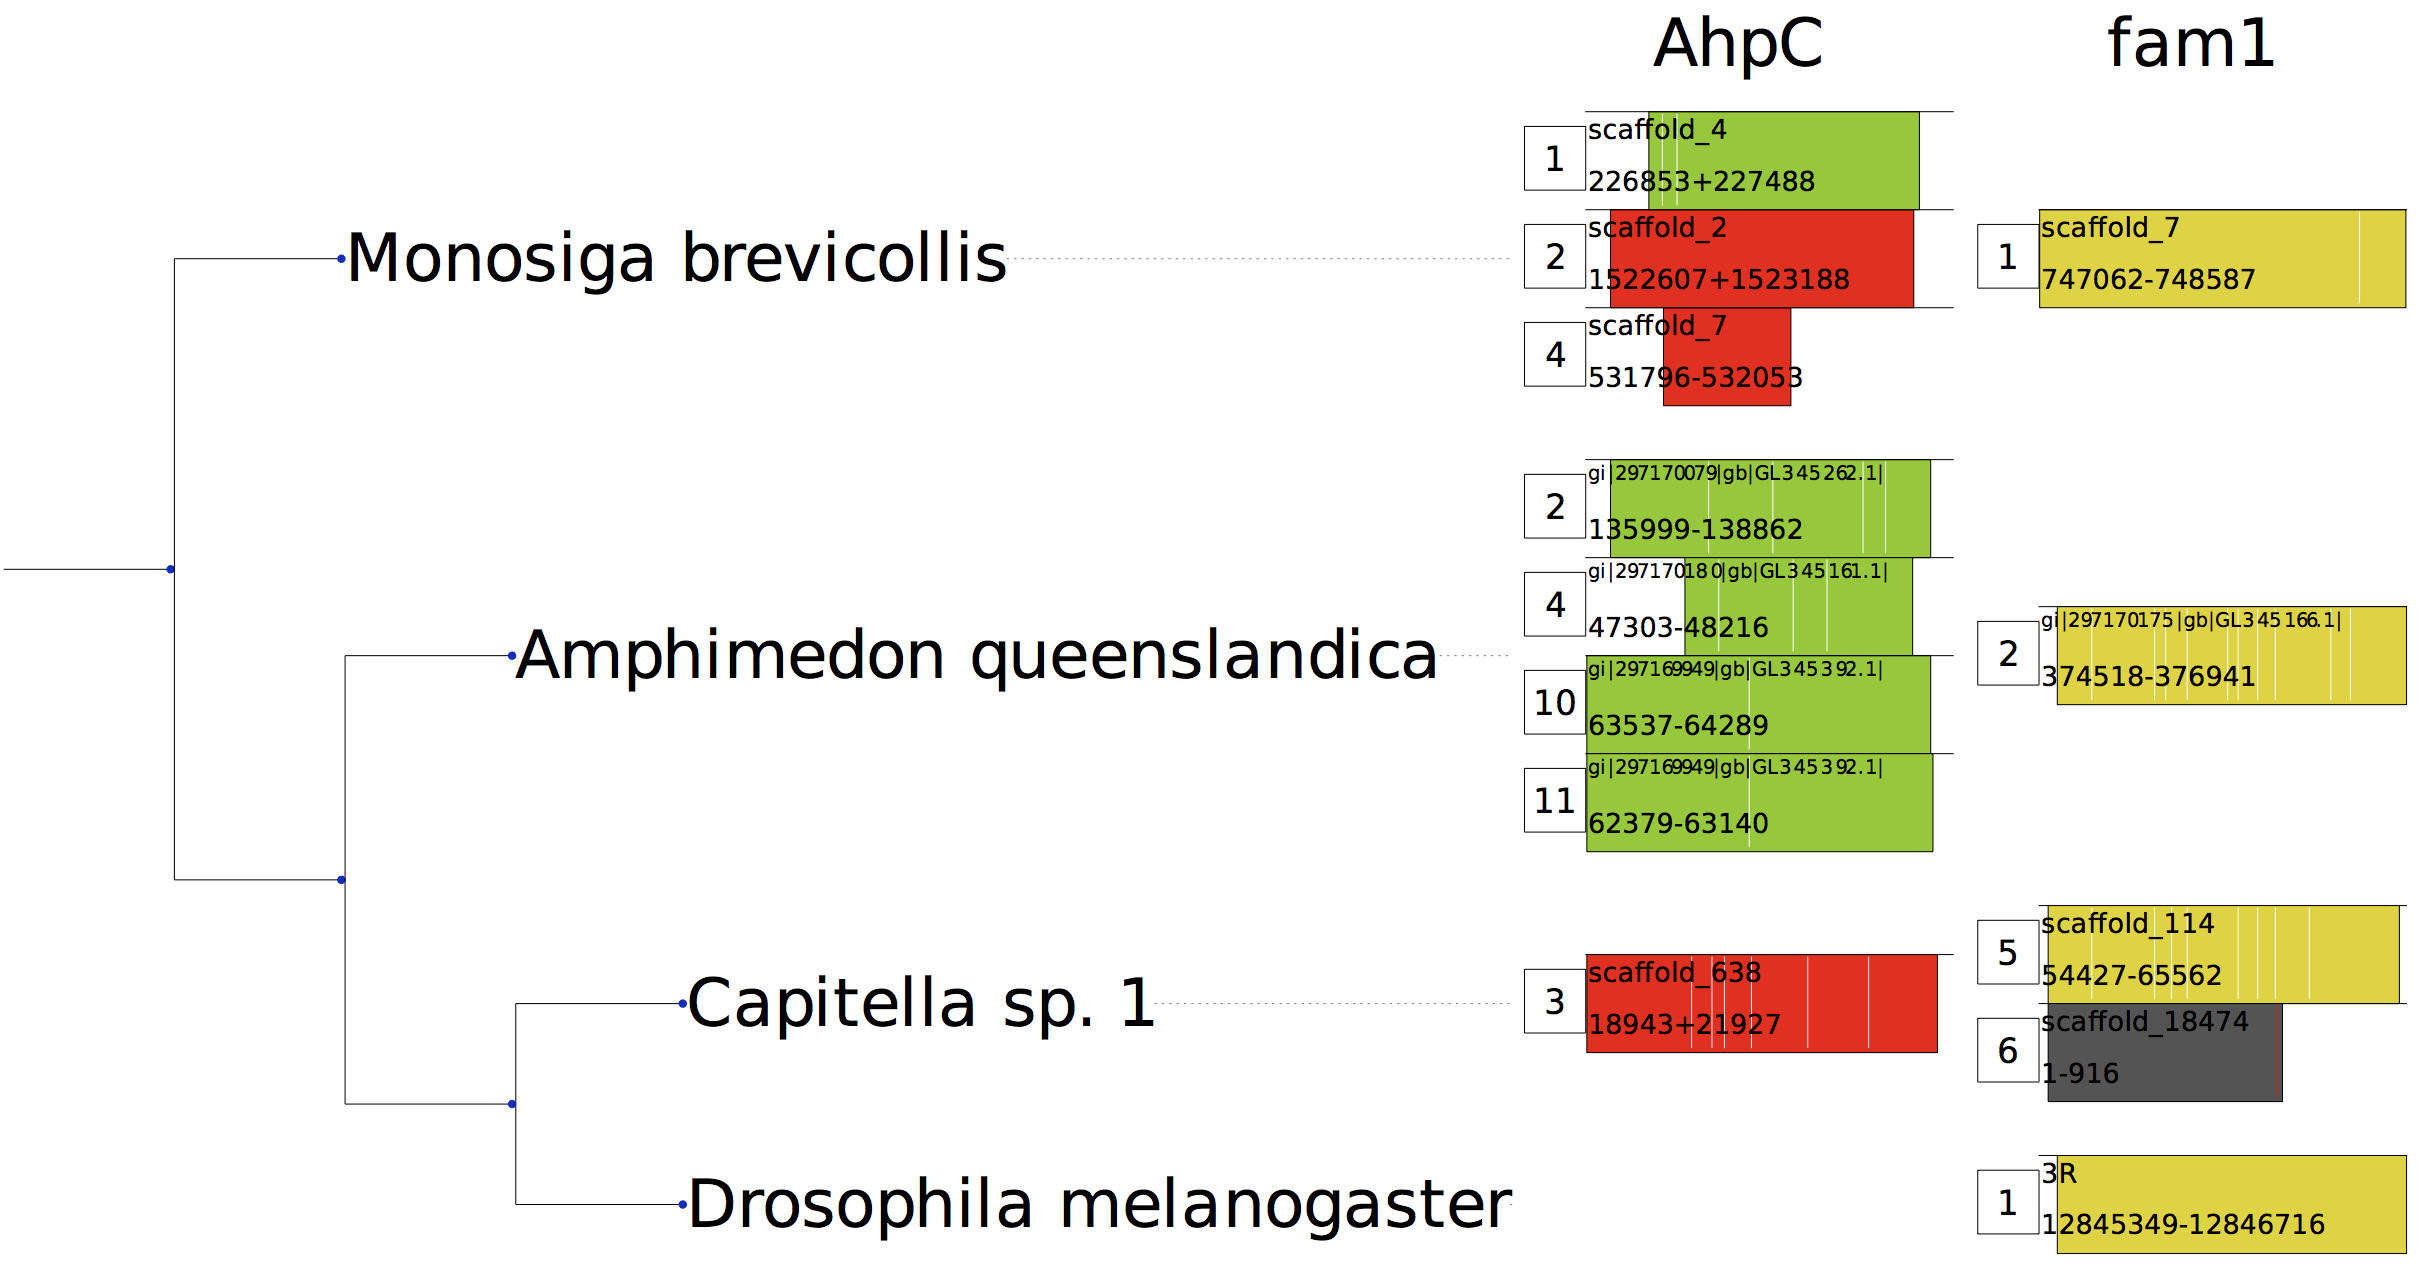
Each result is shown as a colored rectangle. A numeric tag at its left indicates its selenoprofiles numeric index. Each column corresponds to a different profile.
The rectangle width and position indicate the prediction coverage and horizontal span when mapped in the profile alignment. Inside each rectangle you have the chromosome (or contig) name, and the genomic coordinate boundaries, separated with “+” for results on the plus strand, and “-” for results on the minus strand.
Finally, the intron positions as relative to the protein alignment are shown as vertical white lines. When frameshifts are present, they are shown as vertical red lines
Color is used to depict the label of results, e.g. “selenocysteine” results are green, “cysteine” are red, “homologue” are yellow, “pseudo” are grey. To see a list of colors, run:
selenoprofiles drawer -colors
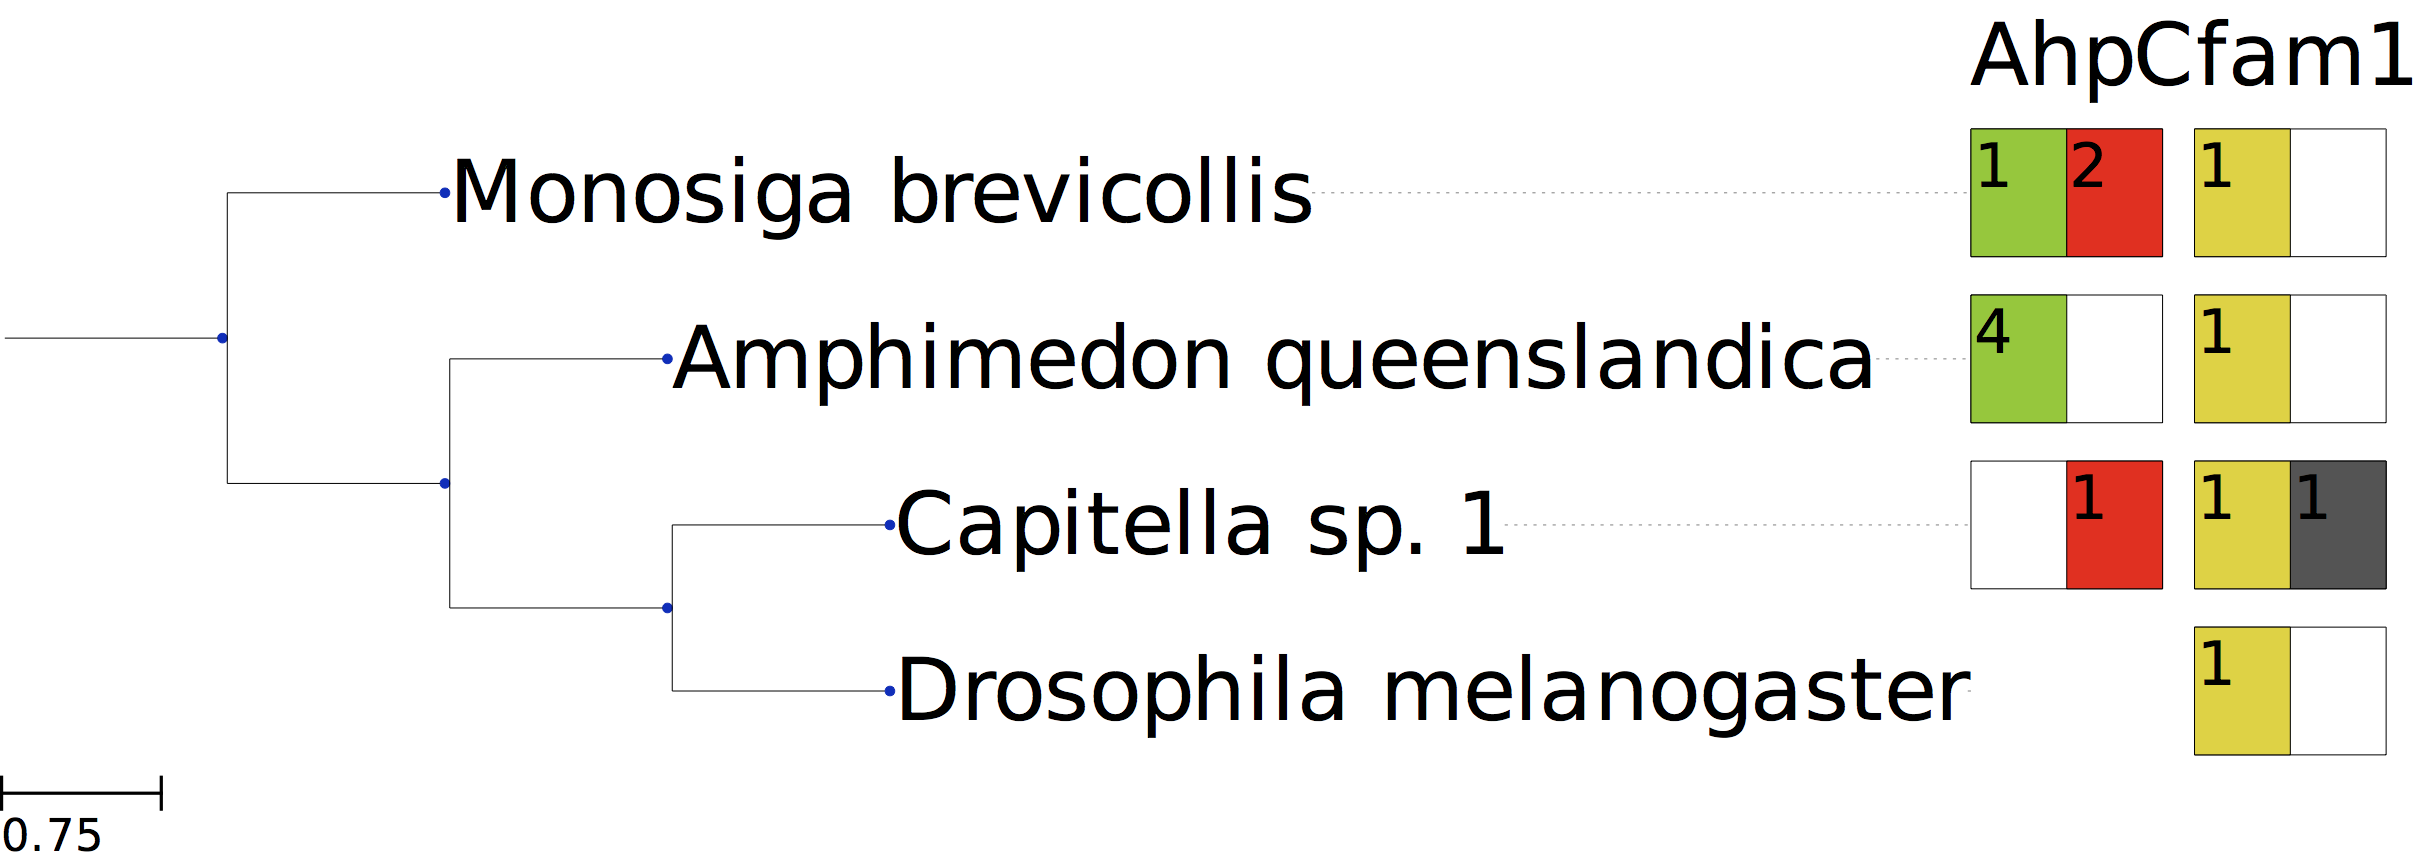
Selenoprofiles drawer becomes more concise with option -a, as it shows only the count of results for each label:
Classify results: selenoprofiles orthology
The selenoprofiles orthology utility is designed to classify results from the joined ali files. This classification is based on orthologous groups, providing insights into the organization of selenoprotein families. See its usage with:
selenoprofiles orthology -h
As output, it produces one tsv file per input file, classifying the subfamily of each selenoprofiles prediction.
- Output columns:
Candidate sequence ID in selenoprofiles format (family.numericID.label.species.target_name)
Subfamily subfamily assigned to this sequence
Similarity similarity score between this sequence and the built-in “anchor” subfamily sequences
The output of selenoprofiles orthology can be used as input of selenoprofiles evolution (run: selenoprofiles evolution -h)
To classify any candidate sequence, we created a series of reference alignments for each multimember family containing up to 10 sequences per subfamily. For subfamily assignment, candidate sequences are then aligned to reference alignments and classified according to the similarity score with every subfamily. The similarity score quantifies how much target sequences “fit” in a certain (sub)alignment. Each candidate is assigned to the subfamily with the highest similarity score.
For families with only a single member, the sequence similarity score is assessed against the overall family profile. This ensures a comprehensive and accurate classification, even for families with a more straightforward structure.
Here’s a minimal command line:
selenoprofiles orthology -i fam1.ali [fam2.ali ... famN.ali] [other options]
These are the compulsory arguments:
-i input alignment file from selenoprofiles join utility.
- Optional arguments::
-of output folder, will be created if non-existing.
-o suffix of the output file. Default: .orthology.
-g how to take into account gaps when comparing sequences. Possible values: {y,n,t,a} Default: n
-m which similarity score metrics is used. Possible values: {i, w} Default: w
-w if AWSI is computed (-m w), define weights per alignment column. Possible values: {m, i, q} Default: m
For meaning of values, see https://pyaln.readthedocs.io/en/latest/alignment.html#pyaln.Alignment.score_similarity
Filtering results: selenoprofiles lineage
The selenoprofiles lineage utility is designed to exclude non-expected genes predicted by Selenoprofiles. This filtering is based on expectations of the various vertebrate lineages from Mariotti et al [1]. See its usage with
selenoprofiles lineage -h
This utility takes the .tsv files produced by selenoprofiles orthology as input. As output, it produces one tsv file per input file, filtering non-expected predictions.
- Output columns:
Candidate sequence ID in selenoprofiles format (family.numericID.label.species.target_name)
Subfamily subfamily assigned to this sequence
Similarity similarity score between this sequence and the built-in “anchor” subfamily sequences
Species species name of the predicted sequence
Pass_filter boolean column indicating if the sequence is expected or not
Discard_description column that provides an explanation for why the filter criteria were not met
Here’s a minimal command line:
selenoprofiles lineage -i fam1.orthology.tsv [fam2.orthology.tsv ... famN.orthology.tsv] [other options]
- These are the compulsory arguments:
-i selenoprotein family fam.orthology.tsv file(s) produced by selenoprofiles orthology (run: selenoprofiles orthology -h)
- Optional arguments:
-of output folder. Default: current directory.
-o suffix of the output file. Default: .lineage.
-temp temporal folder to save intermediate files.
-a optional output .ali file. Requires the input .ali file used in selenoprofiles orthology. Outputs an alignment of the filtered sequences.
-all decides whether to keep or not selenoprotein homologs
-exp provide own expectation table
-map map manually species to lineage. Avoids using NCBI_DB. User needs to provide a species /t lineage table.
-pexp print the expectation table
-l include lineage in the output table
Mariotti, M. et al. Composition and Evolution of the Vertebrate and Mammalian Selenoproteomes. PLoS One 7, e33066 (2012).
Assessing annotations: selenoprofiles assess
The selenoprofiles assess utility evaluates genome annotations using selenoprofiles predictions as bona fide selenoprotein annotation. See its usage with:
selenoprofiles assess -h
This tool has three different inputs: selenoprofiles gtf file, genome gff file and genome fasta file. It produces two outputs: A tsv file with the annotation for each genome transcript and a tsv file with the annotation for each genome gene.
Here’s a minimal command line:
selenoprofiles assess -s selenoprofiles.gtf -e genome.gtf -f genome.fa [other options]
- These are the compulsory arguments:
-s selenoprofiles predictions in gtf or gff format
-e genome annotations in gff or gff3 format
-f genome fasta file
Optional arguments:
-o Specify the name of the output tsv table containing annotation for each genome transcript.
-agg Specify the name of the output tsv aggregate table containing annotation for each gene.
-cs Specify the name of selenoprofiles column which will be taken as ID to work with. Default is transcript_id.
-cg Specify the name of input genome’s column which will be taken as ID to work with. Default is ID.
-stop Specify if stop codons are removed and how. Three options available: ‘auto’, ‘all’ and ‘no’. Default is ‘auto’.
‘auto’ In case some genome transcripts have stop codons and some not. Searches for transcripts with stop codons and removes them.
‘all’ The last three positions from each genome transcript are removed, without performing any search.
‘no’ Assumes there are no stop codons in genome transcripts, so they aren’t removed.
Validating selenoprofiles: selenoprofiles test
The selenoprofiles test utility verifies that a selenoprofiles is working correctly. It performs several automated test runs across multiple selenoprotein families using a small FASTA dataset to ensure that the main executable and dependencies (such as BLAST, Exonerate, and Wise2) function as expected.
The tool executes a set of functional tests on predefined selenoprotein families — MSRB, DIO, SEPHS2, and GPX — and checks for expected annotation markers in the output.
See its usage with:
selenoprofiles test [-b path_to_selenoprofiles] [-i input_fasta] [-o output_folder]
- Arguments
-b (Optional) Path to the selenoprofiles executable. If not provided, the tool auto-detects it using which selenoprofiles or which selenoprofiles4.py.
-i (Required) Input FASTA file containing the test sequences.
-o (Required) Output folder where the test results will be written.
-h, –help Show this help message and exit.